Grouping & Filtering Data
Grouping & Filtering Data
The Rayven Platform can slice and dice your data, offering powerful flexibility for your dashboard permissions and displays.
Devices
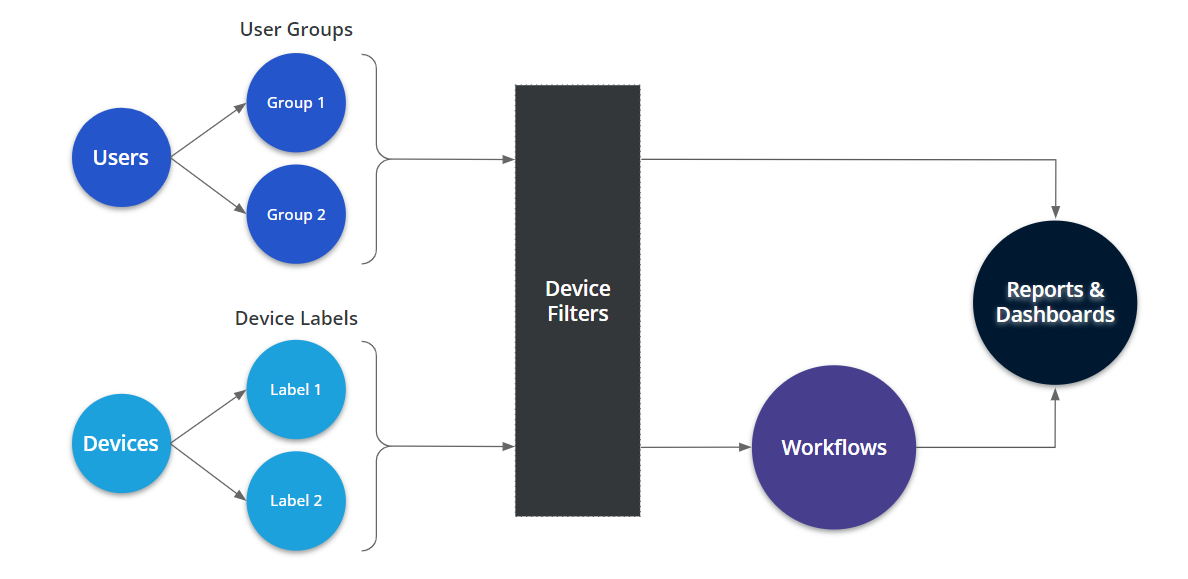
All devices saved in Rayven can be labelled using attributes (for example, asset type, city name, or location). Device Labels allow you to slice and dice your data based on different options. For example, you could use them to reveal all devices with the location label 'New York'.
Device Filters
You might want to group data by multiple labels. Device filters allow you to combine two or more device labels to group and filter data.
For example, a device filter for asset type labels set to 'Bus' and location labels set to 'New York City' would display all New York buses.
Use Device filters to:
- Aggregate data or make calculations based on specific groupings.
- Moderate which users see which data.

User Groups
Every user in Rayven needs to be associated with a user group. User groups allow you to easily control what data and dashboards each individual can access, based on characteristics like role or location.
For example, creating a 'New York' user group with a 'New York' device filter would ensure your New York users only saw data from this location.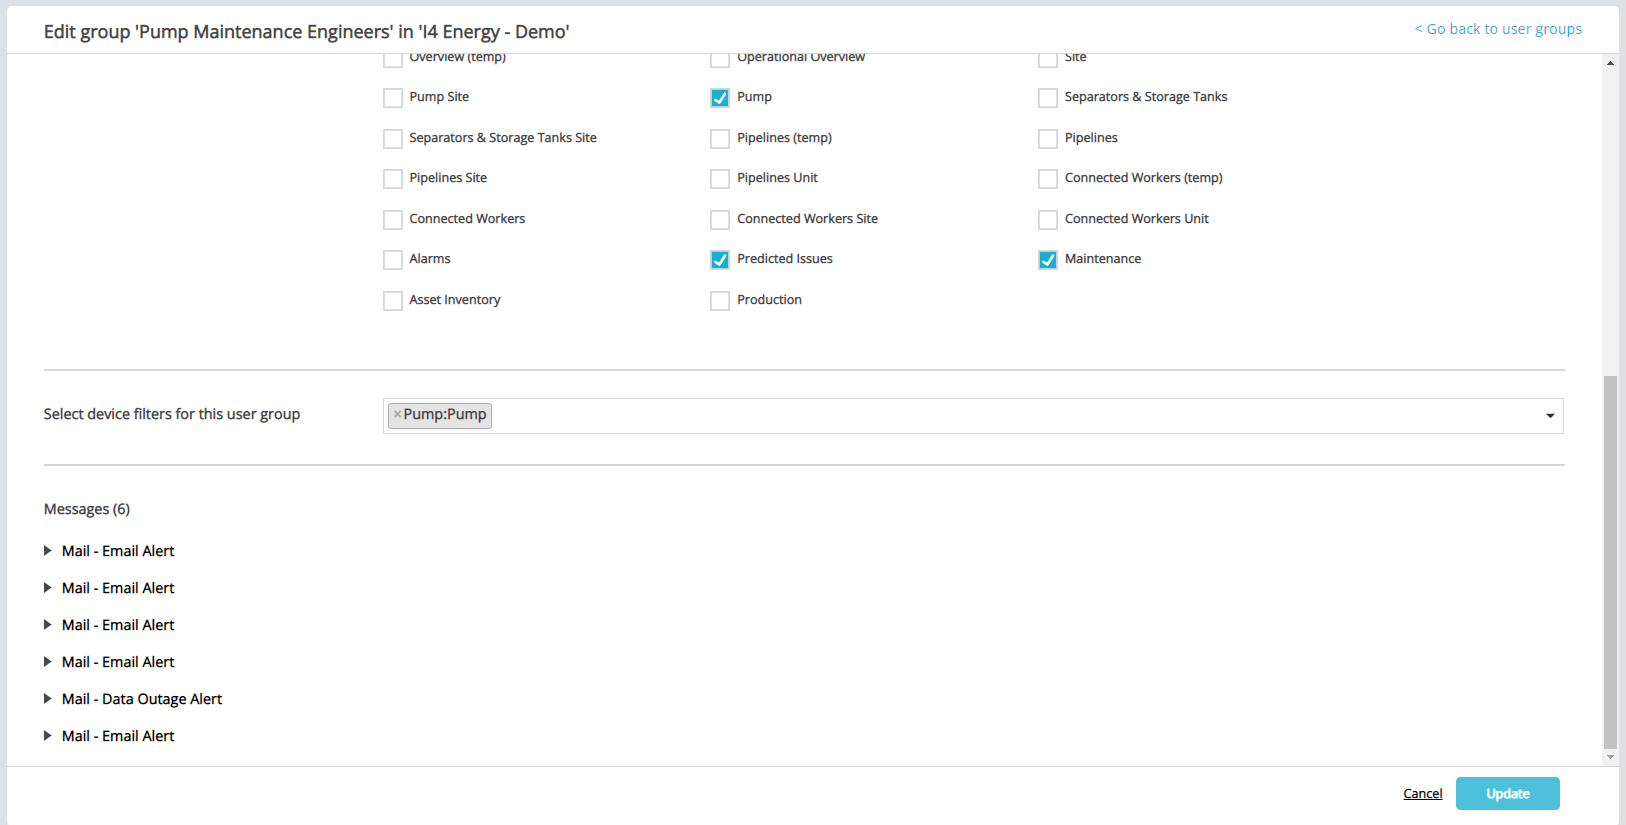
Grouping workflow data
Workflows are the primary way for your devices to communicate with services and each other. They are, in essence, the brains of your connected solution, allowing you to trigger notifications, create events, send device commands, and more.
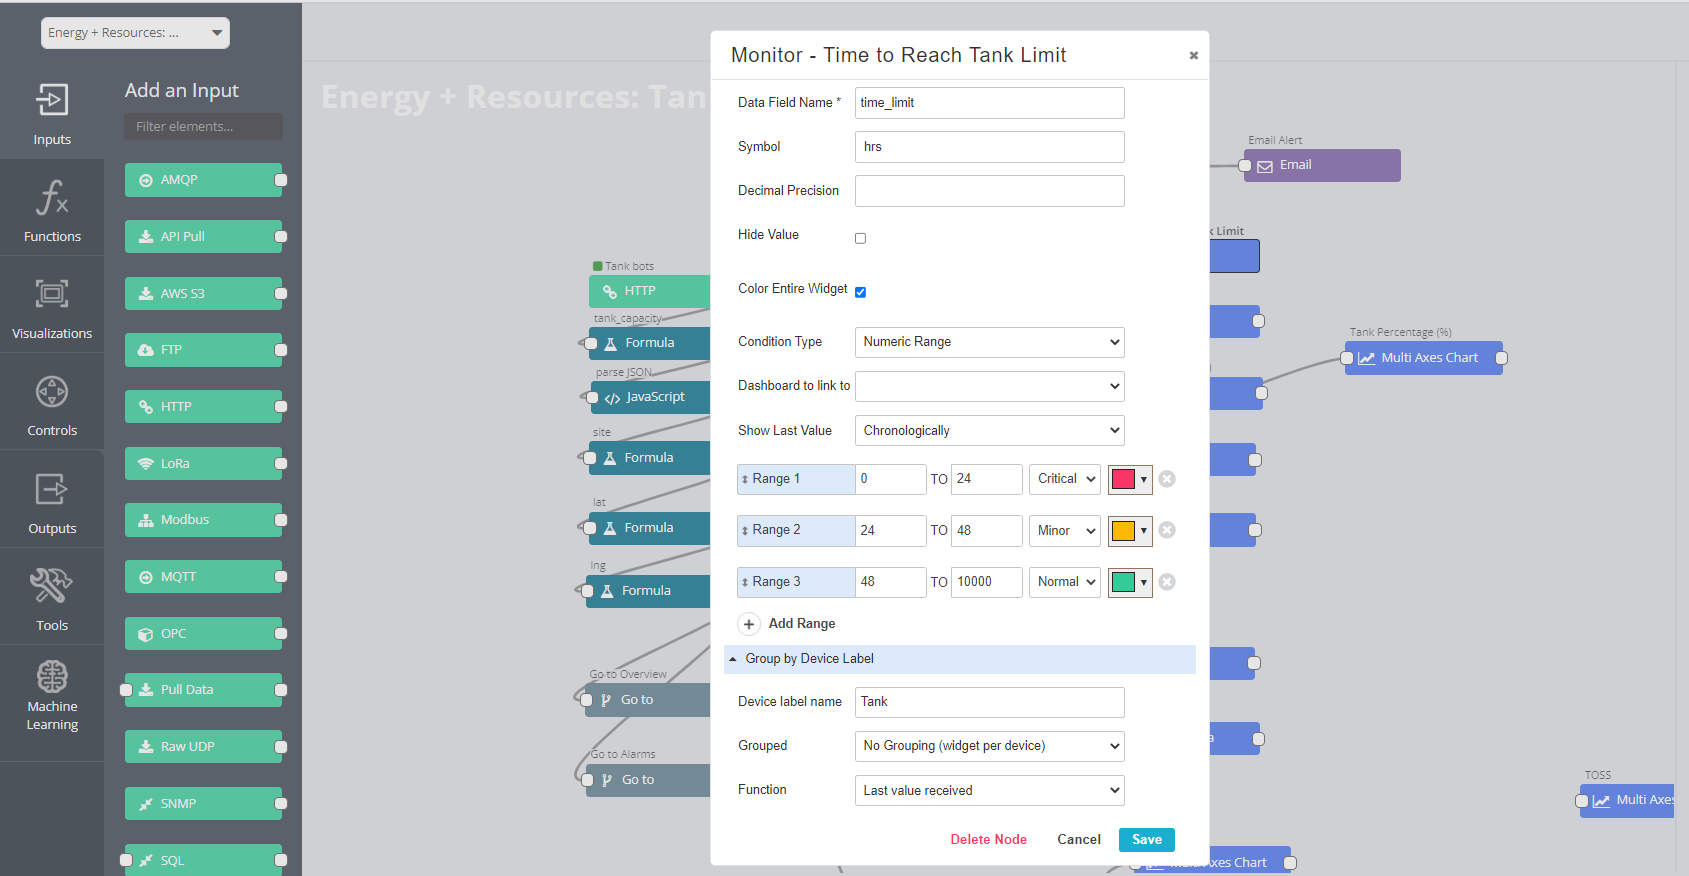
Throughout your workflow, you may want to filter or group your data. You can choose if and how you want to filter workflow data for each widget.
Filtering report and dashboard data
Rayven Dashboards provide a flexible and powerful way to display information from your solution. Dashboards enable you to visualize changes and patterns in your data over time and detect anomalies.
Filter what data is shown in a dashboard by choosing appropriately filtered widgets when configuring your dashboard node.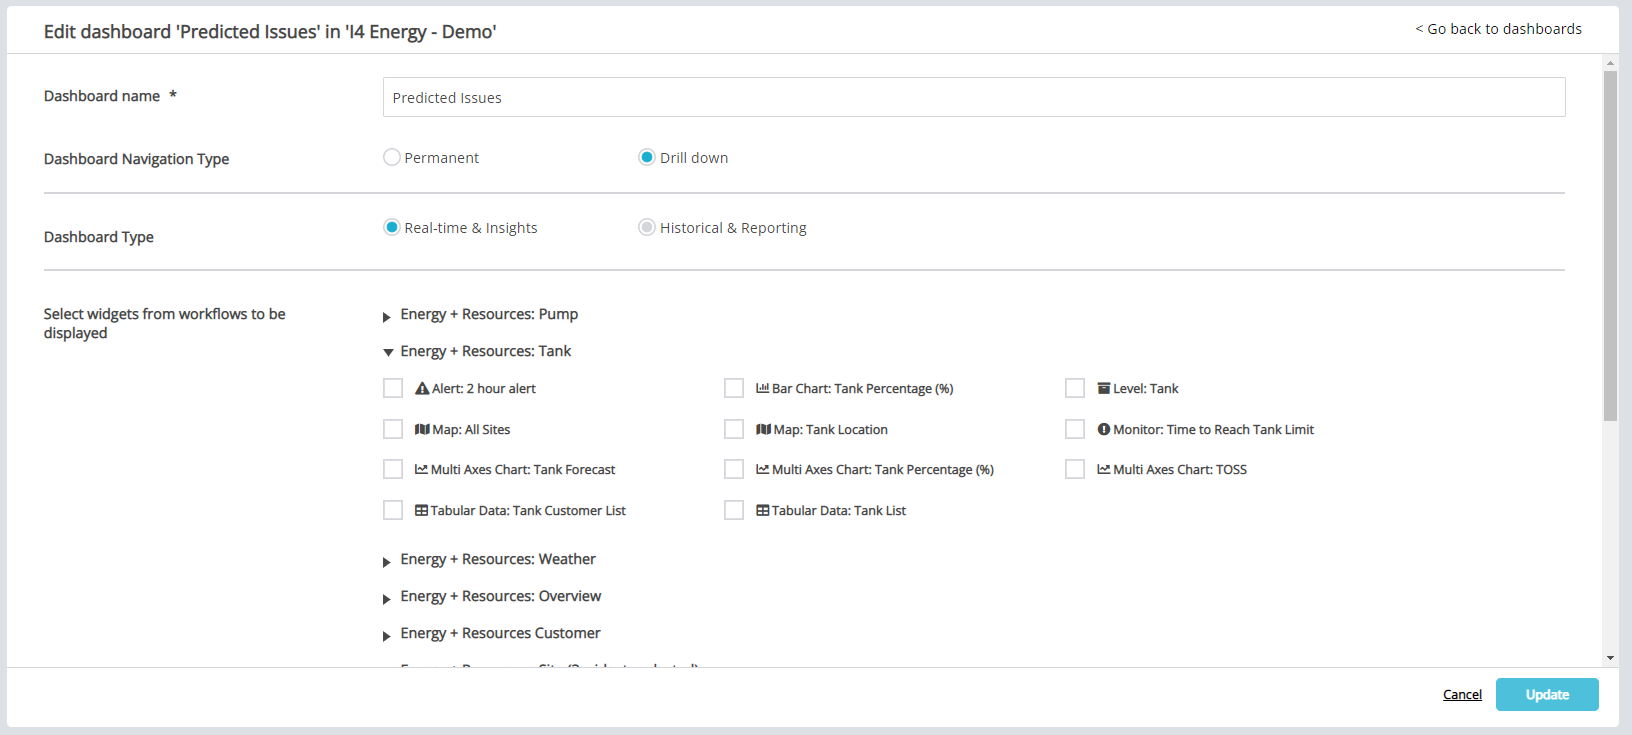
Grouping and filtering in action
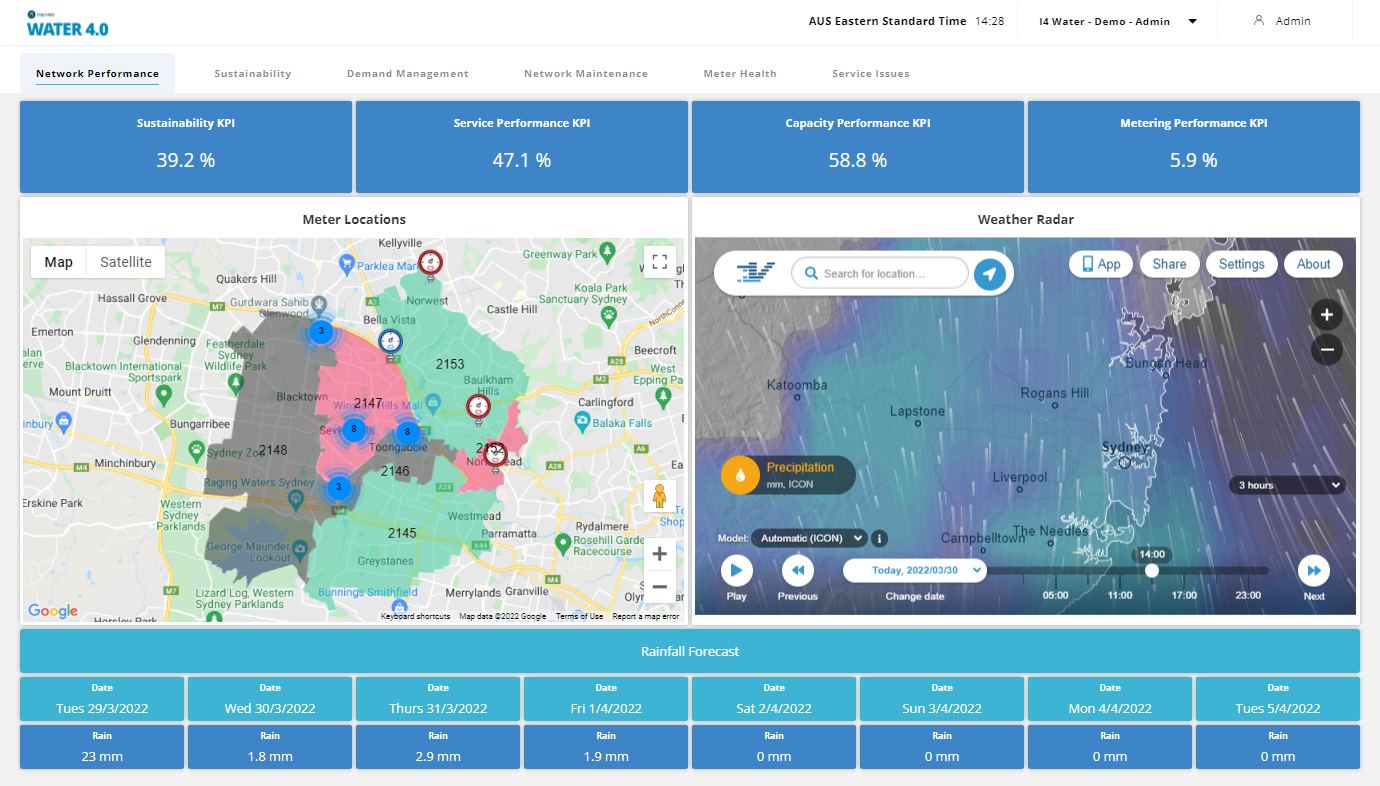
To demonstrate, lets take the example of a solution for the water industry. The solution displays water asset performance metrics for different cities and states depending on the appropriate user group.
In the city of Sydney dashboard below, we have:
- Filtered the display, so only data from assets and devices in Sydney is shown.
- Aggregated and grouped data across the entire fleet of Sydney assets and devices.
- Included the option to drill down to a postcode level, house level, and asset level.
- Provided logic and visualizations for the Sydney maintenance user group to assess performance quickly.
- Provided dashboard access permissions to only the Sydney maintenance user group.
